Environment 121: Conservation of Biodiversity
Topic: Demography of Metapopulations
19 April 2007
Conservation in the news:
- "Why American songbirds are vanishing" NPR's Morning Edition, April 18.
http://www.npr.org/templates/story/story.php?storyId=9605365
- "This report was focusing on a bat that was eating migratory birds. Based on the article in the reader, predators have been found to have an impact on the decreasing migratory songbirds. Even though these bats don't cause a major dent in migratory bird density like other rodents do, it just shows that new information is always being found on a daily basis that influences previous knowledge."
--Submitted by student
- Florida may need to tap Everglades, Officials say
- http://www.latimes.com/news/nationworld/nation/la-na-drought17apr17,1,1338647.story
- LA Times, April 17, 2007
Outline of Lecture
Sources for today's lecture:
- Meffe, Carroll, et al. 1997. Principles of Conservation Biology, 2nd Ed. Sinnaur Press.
- Web site on Population Viability Analysis (H. R. Akçakaya, M. Burgman and L. Ginzburg)
I. Population viability analysis
A. Definitions
1. Study of extinction probabilities of individual species due to:
- environmental uncertainty
- demographic stochastic
- natural catastrophes
- genetic factors (founder effects, genetic drift, inbreeding)
2. Demographic uncertainty:
a. random events in survival and reproduction of individuals
- e.g. skewed sex ratio, unusual but random sequence of deaths
b. mainly effects small populations
3. Environmental uncertainty or stochasticity:
a. changes in weather, food supply, and the populations of competitors, predators and parasitesb. affects populations of all sizes
4. Natural catastrophes
a. extreme cases of environmental uncertainty
b. infrequent, short in duration, widespread in impact
5. Genetic uncertainty
a. To be discussedb. important for small populations
B. Thresholds of population responses
1. dramatic changes in population size over short periods of time
2. Population reaches a certain size and previous dynamics of birth and death rate suddenly change.
3. Lande developed a general metapopulation model to model thresholds of population change
4. Elements of Lande model
a. two habitat types: suitable and unsuitable
b. p-hat: proportion of territory that is occupied
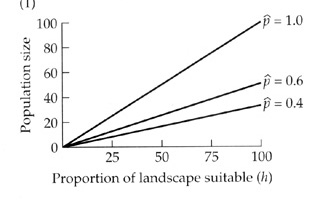
--> In this model, the equilibrium population size declines linearly as the proportion of landscape that is suitable declines
c. m: dispersal ability of species. (Species with high m will be able to find a new suitable site)
d. R0: net reproductive rate is used as measure of female Reproductive success.
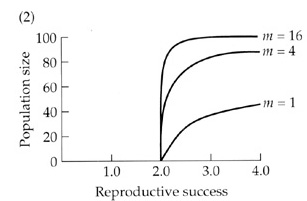
--> The decline of population size with decreasing RS is nonlinear.
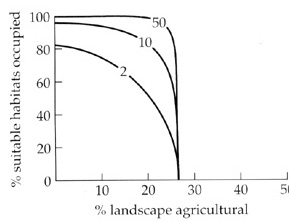
5. Pulliam's modification of Lande model: bird territories next to agricultural land with pesticides
a. As greater proportion becomes agricultural, average RS decreases
b. Equilibrium population size as a function of dispersal ability, suitable habitats occupied (p-hat), and proportion of land agricultural.
C. Components of PVA Analysis
Source: Web site on Population Viability Analysis (H. R. Akçakaya, M. Burgman and L. Ginzburg)
- Identification of a question
- What is the chance of recovery of the Spotted Owl?
- What is the risk of extinction of the Florida Panther
- What is the best strategy for reintroducting and conserving Black-footed ferrets?
- Is it better to have one large habitat patch or multiple patches? Should there be corridors between them?
- Determine the model structure
- Structure of PVA will depend on the ecology of the population or metapopulation

- Estimating model parameters
- Running the model
- Sensitivity analysis
- Implementation, monitoring, evaluation

Background
- Federally threatened species occupying coastal sage scrub community
- Started with a habitat model for the species (see habitat suitability map)
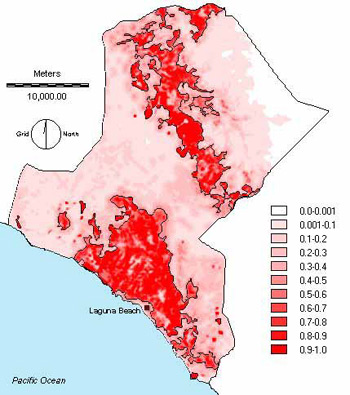
3. Used demographic data to conduct a PVA
- stage-structured, stochastic, spatially-explicit metapopulation model
4. Assessed risk of extinction various options
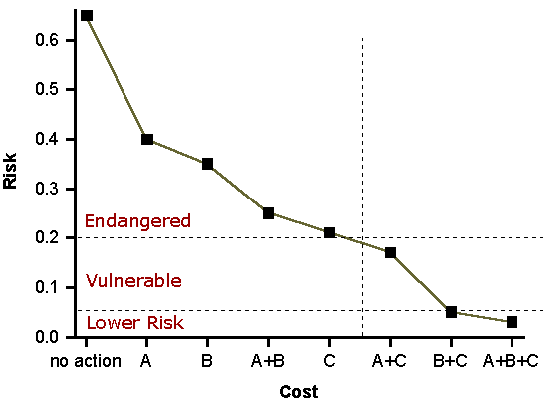
Options:
- A: Restore only the small patch
- B: Restore medium size patch
- C: Restore large patch
II. Landscape approach
A. Definition
1. Landscape is a mosaic of habitat patches across which organisms move, settle, reproduce, and die.
2. habitat boundaries: determined by contrasts in habitat type and possibly management history
3. requires spatially explicit data (e.g. GIS)
4. Involves increase in scale and attention to landscape mosaic
B. Spatially explicit models
1. Incorporate actual location of models
2. Includes range of spatially explicit information about each location
3. MAP models: Mobile Animal Population
a. type of spatially explicit model
- habitat-specific demography
- dispersal behavior of organism
b. model can simulate changes in population size based on frequencies of different habitat types
c. can be used to evaluate management plans
III. Introduction to Metapopulation Biology
A. General definition:
B. Assumptions of approach
1. Metapopulation are composed of discrete subpopulations
2. Some degree of migration
3. If migration is high, the set of populations will be one large
population
4. Physical separation of patches
5. Models are based on persistence and existence of patches, not
numbers of individuals within patches.
6. Regional or landscape scale
C. Types of Metapopulation Models (from Harrison and Taylor 1997)
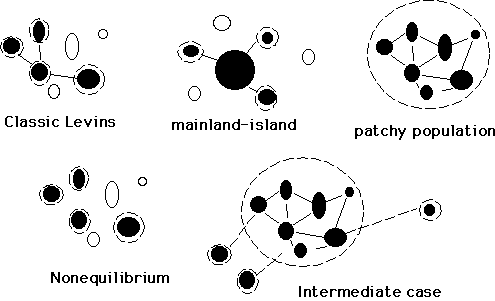
Fig. 1. Metapopulation models all share the dynamics of extinction
and migration among patches. However, each case demonstrates a
different range of variation in migration. Lines indicate migration;
dashed lines outline indicate high migration; hollow circles indicate
unoccupied patches.
IV. The theory of Sources and Sinks
A. Background
B. Mathematical model for source/sink dynamics
1. nT+1 =PAnT + PJbNT = nT(PA + bPJ)
where
- nT+1 is the number of individuals at end of winter
- b is the average number of offspring per adult
- PA is the adult survival during nonbreeding season
- PJ is the juvenile survival during nonbreeding season
- l= PA + bPJ
- average l for many years is geometric mean of annual lambdas
*** Remember: nt = no l t = no e rt
2. For source sink model:
Source population: l is greater than 1 (e.g. 1.5)
- n1* = maximum number of breeding birds
- Let's say that n1*=100
- n1*(ave lamda1 - 1) = number of emigrants
- Thus, m=50 for our example
Sink population: (l is less than 1)
- n2* = [n1*(l1 - 1)]/ (1-l2)
- For example
- Sink: l=.75
- n2* = 50/(1-.75)= 200
==> Population size alone can be misleading because source population size can be less than sink size
V. Metapopulation Terminology
(Modified from Hanski and Simberloff, 1997)
| Term (synonym) |
Definition |
|
patch (island; population site; locality)
|
A continuous area of space with all necessary resources for the
persistence of a local population and separated by unsuitable
habitat from other patches; may be occupied or empty. |
|
Local population (population; subpopulation; deme)
|
Set of individuals that live in the same habitat patch and therefore
interact with each other; most naturally applied to "populations"
living in such small patches that all individuals practically
share a common environment; may or may not include all randomly
mating individuals as defined in population genetics approach. |
|
Metapopulation (composite population)
|
Set of local populations within some larger area, where typically
migration from one local population or at least some other patches
is possible; (definition of metapopulation has broadened in last
five years). |
|
Metapopulation structure (metapopulation type)
|
Network of habitat patches that is occupied by a metapopulation
and that has a certain distribution of patch areas and interpatch
migration rates. |
|
Levin's metapopulation (classical metapopulation; narrow-sense metapopulation)
|
Metapopulation structure assumed in the Levins model (1969): a
large network of similar small patches, with local dynamics occurring
at a much faster time scale than metapopulation dynamics; in a
broader sense used for systems in which all local populations,
even if they may differ in size, have a significant risk of extinction. |
| Mainland-island metapopulation |
System of habitat patches (islands) located within dispersal distance
from a very large habitat patch (mainland) where the local population
never goes extinct; similar to island biogeography model. |
| Source-sink metapopulation |
Metapopulation in which there are patches in which the population
growth rate at low density and in the absence of immigration is
negative (sinks) and patches in which the growth rate at low density
is positive (sources); this definition differs from that of Pulliam
(1988) when he first proposed source-sink dynamics to include
small patches that have a low but positive equilibrium value in
absence of migration. |
| Nonequlibrium metapopulation |
Metapopulation in which (long-term) extinction rate exceeds colonization
rate or vice versa; an extreme cases is where local populations
are located so far from each other that there is no migration
between then and hence no possibility for recolonization. |
| Turnover |
Extinction of local populations and establishment of new local
populations in empty habitat patches by migrants from existing
local populations. |
| Metapopulation persistence time |
Length of time until all local populations in a metapopulation
have gone extinct. |


